Bar graph papers are shared here that are used to make bar graphs. Bar graphs are made for data handling in statistics. A bar graph paper is used to accurately plot data in the form of vertical or horizontal rectangular bars, where the length of the bars is proportional to the measure of data. A bar graph is also known as a bar chart. On this page, we have shared multiple bar graph paper templates that are available for free download in a printable format.
Usually, data is present in the form of numbers, understanding numbers is a bit complex process, and going through so many numbers is confusing for a lot of people. Bar graphs or bar charts are introduced in order to simplify the data and present it in the form of pictorial graphs or charts. Understanding graphs or charts is much easier that those number sheets.
Bar Graph Paper Template
For easy understanding and proper representation of data, you can provide it in the form of tables, pie charts, polygons, bar graphs, etc. A bar graph or chart is one of the ways through which data can be represented in easy to understand format. A bar graph paper is required to make a bar chart and on this page, you can see multiple bar graphing paper templates.
What is Bar Graph?
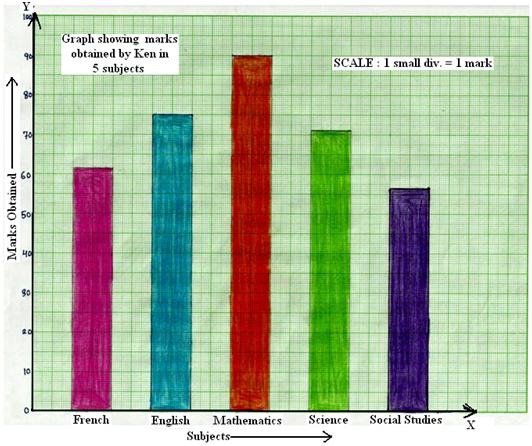
A bar graph or chart is known as the pictorial representation of grouped data. In bar charts, data is represented in the form of vertical or horizontal rectangular bars, where the lengths of the bars are equivalent to the measure of data.
a bar graph is used to compare the different data sets
two axes are there on a bar graph where one axis shows the categories and the other axis shows the discrete values
a bar graph shows how the data is changing over a period of time.
What are the Parts of a Bar Graph?
Following are the many parts of a bar graph:
- Vertical axis
- Horizontal axis
- Every bar graph has a title that highlights the purpose of a graph
- The title of the horizontal axis indicates the information that is shown there.
- The title of the vertical axis indicates the data it is used to display.
- The categories on the particular axis indicate what each bar represents.
Bar Graph Paper Template
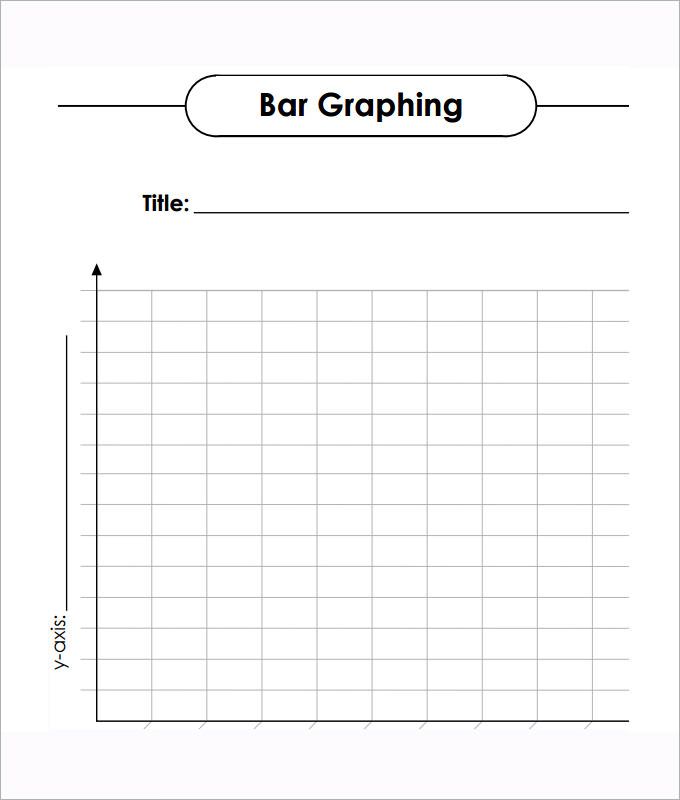
Bar Graph Paper Template
What’s the Purpose of Using Bar Graphs?
The whole purpose of using bar graphs is to represent the data in the form of a chart. Understanding data in the form of graphs or charts is much easier and this is the reason bar graphs are made. Bar graphs or charts are made by individuals, businesses, institutes, etc. A normal person understands charts much better than data in the form of a number sheet.
You can see the use of bar graphing papers commonly in the domain of mathematics and statistics. Bar graphs generally referred to as bar charts, are graphic illustrations of grouped data. If you are a student or working professionally in the field of mathematics or statistics then you must know how to make bar graphs or charts, and you must know how to use graph paper to represent the data in the form of charts or bars. Every student must have a basic understanding of bar graphs if they are working in the data statistics domain.
For accuracy purposes, graph papers are used to make bars or charts. If you want to learn the process of making a bar chart or graph then you can check out the graphing papers here, download one for your use, and start using it. On this site, you can find out a different types of graphing paper templates.